Find lines with the matched filter
This tutorial runs on the CASA-free test fixture: jackknifed noise of the line13_line9 mock with two Gaussian lines injected at known positions. DataHandler(msfile) reads a measurement set into the same structure.
[1]:
%matplotlib inline
import numpy as np

from luv_finder import DataHandler, Gaussian, MatchedFilter
from luv_finder.plotting import response_check, spectrum_check
Data
The visibilities are held per (field, spectral window) as a Chunk: the weighted visibilities X = w * V and the weight w of every visibility (0 where flagged) per channel and row, and u, v, time, baseline and scan once per row.
[2]:
data = DataHandler.from_npz("../../../tests/fixtures/line13_line9_small.npz")
(chunk,) = data.chunks
n_chan, n_row = chunk.X.shape
print(f"{n_row} rows x {n_chan} channels, {data.nbytes / 1e6:.1f} MB")
1368 rows x 50 channels, 1.4 MB
Line 1
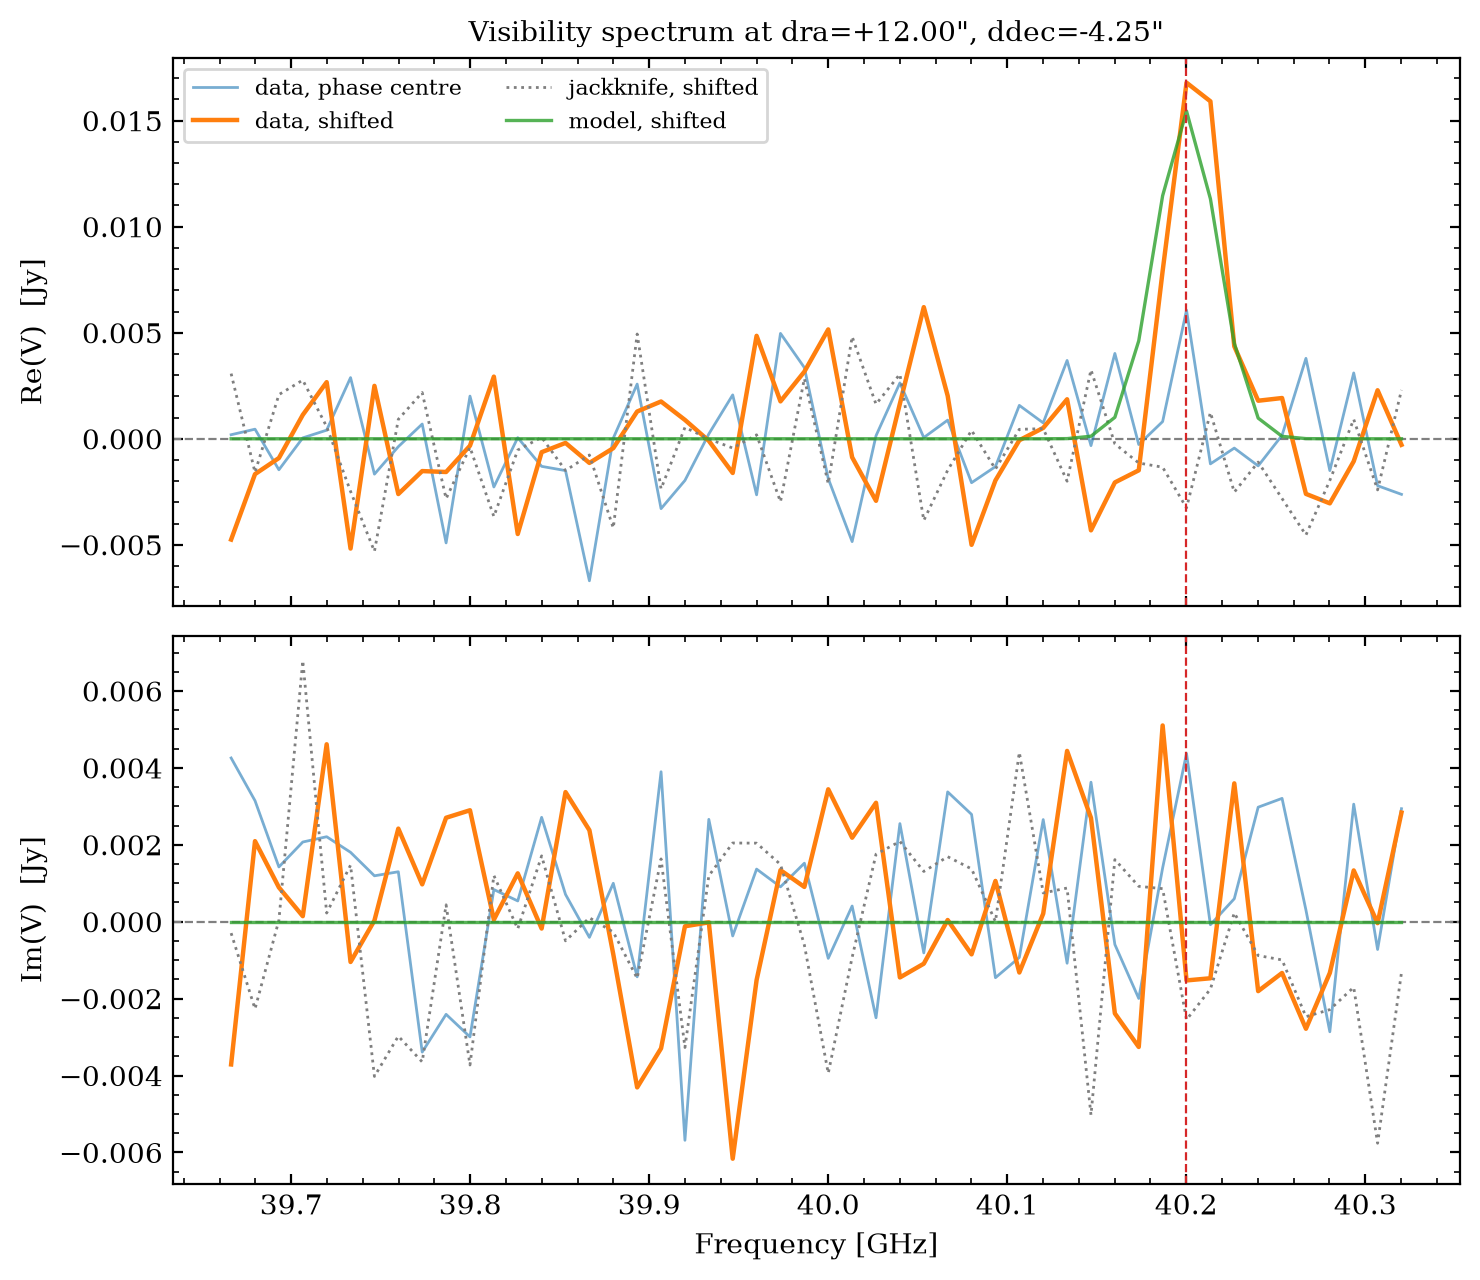
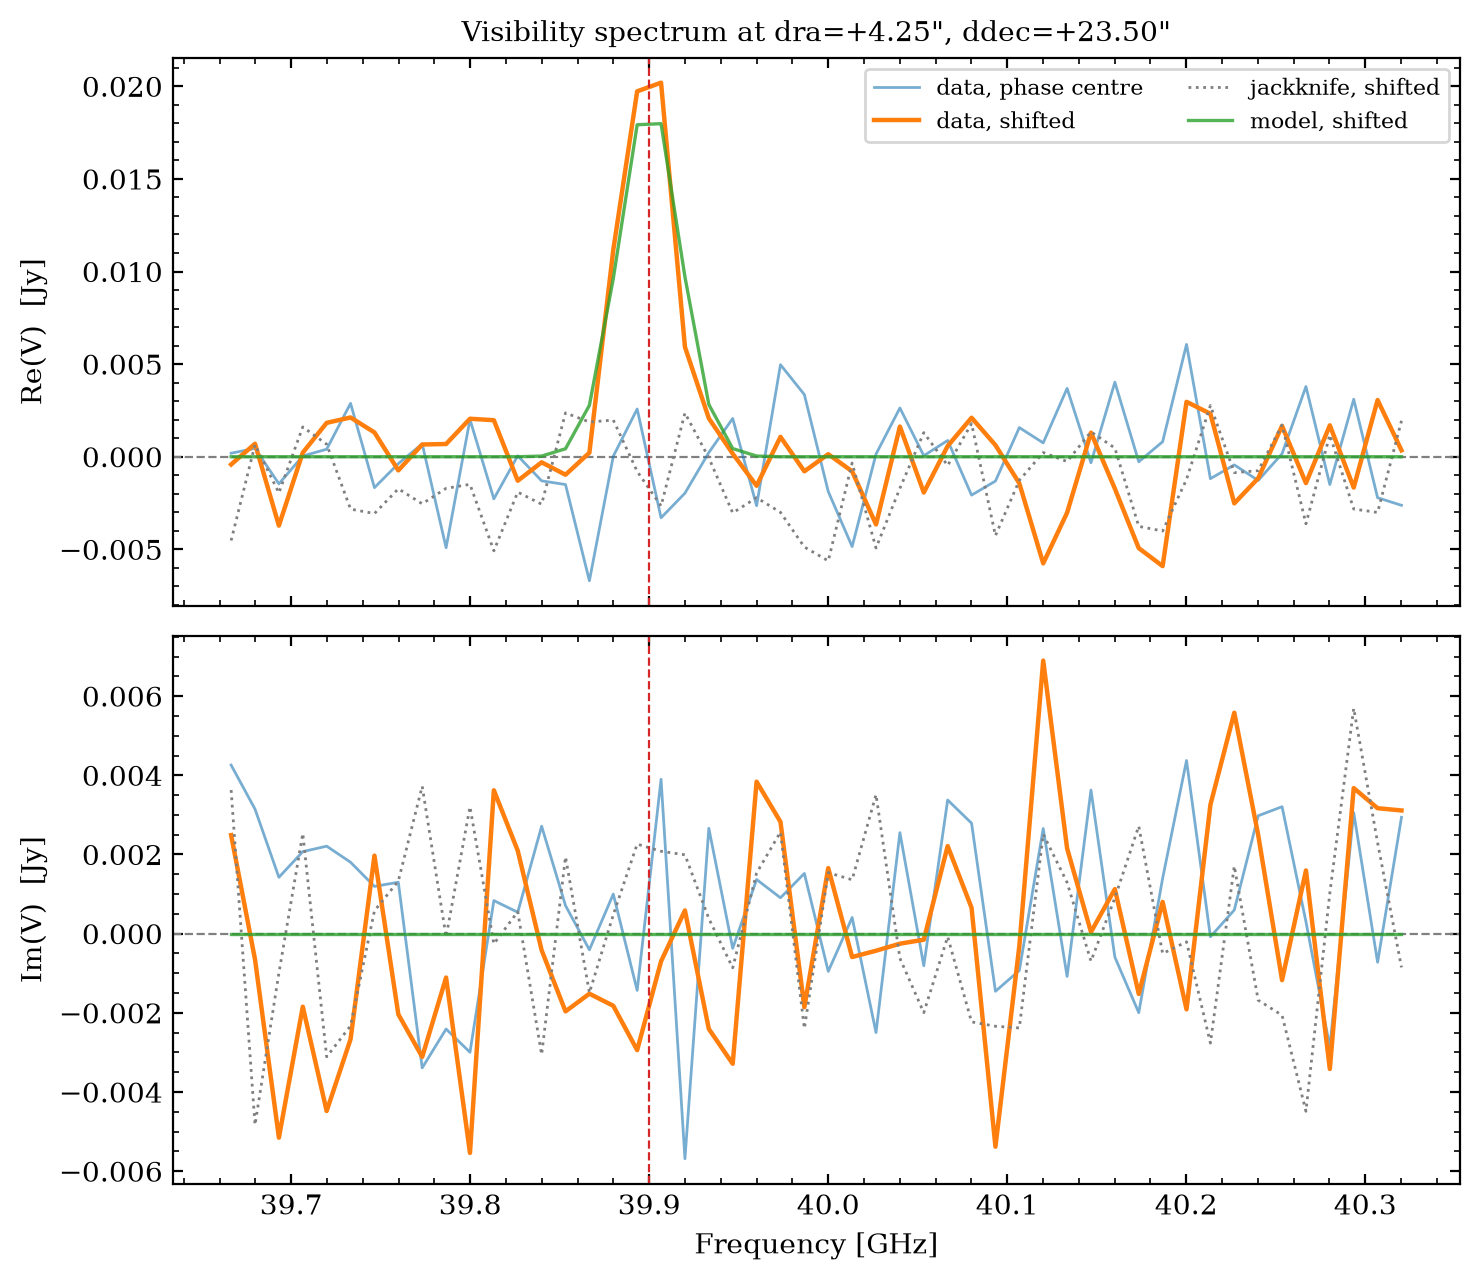
Weighted-mean visibility spectra. At the phase centre the offset line averages away; phase-shifted onto its position it appears in the real part, matching the model, while the jackknife stays consistent with zero.
[3]:
line1 = Gaussian(dra=12.0, ddec=-4.25, total_flux=5.1, bmin=0.78, bmaj=0.78, nu_center=40.2e9, width=300)
spectrum_check(data, 12.0, -4.25, model=line1, line_ghz=40.2)
[3]:
Line 2
[4]:
line2 = Gaussian(dra=4.25, ddec=23.5, total_flux=6.4, bmin=0.78, bmaj=0.78, nu_center=39.9e9, width=300)
spectrum_check(data, 4.25, 23.5, model=line2, line_ghz=39.9)
[4]:
Matched filter
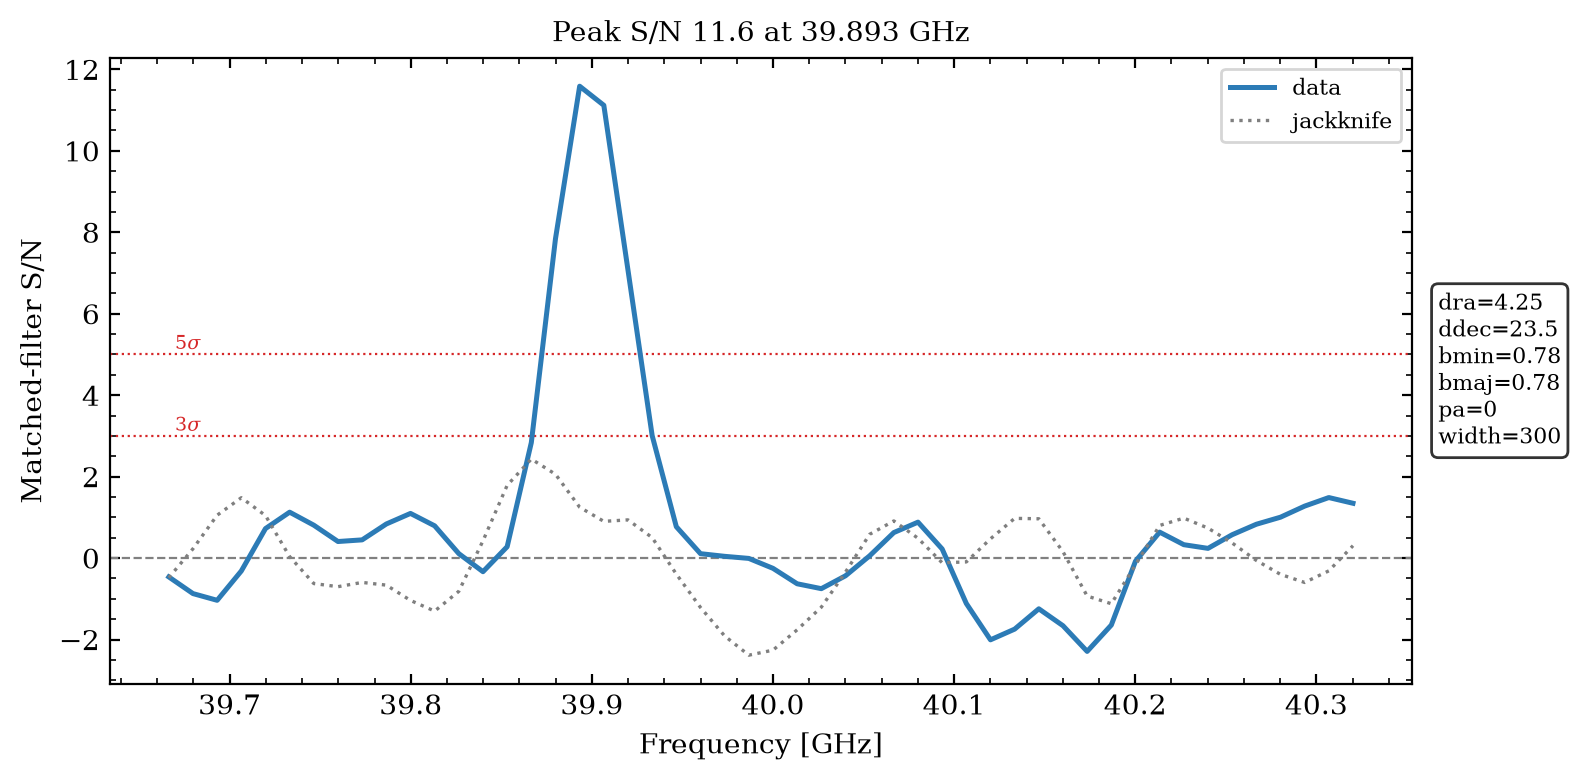
Search both positions with a 300 km/s template of the sources’ size (FWHM 0.78”). The response is in signal-to-noise units, so each on-source grid point peaks at its line’s S/N, and the jackknife shows the noise floor on the same axis.
[5]:
grid = {"dra": [12.0, 4.25], "ddec": [-4.25, 23.5], "bmin": 0.78, "bmaj": 0.78, "width": 300.0}  # FWHM
mf = MatchedFilter(data, grid)
mf.run(jackknife=True)

freqs = mf.frequencies()
for params, response in zip(mf.grid_params, mf.response):
    i = np.argmax(response)
    print(f"dra={params['dra']:+6.2f} ddec={params['ddec']:+6.2f}: "
          f"peak S/N {response[i]:5.1f} at {freqs[i]:.3f} GHz")
print(f"jackknife max |S/N| {np.abs(mf.response_jackknife).max():.1f}")
Windows: 0%| | 0/1 [00:00<?, ?it/s]An NVIDIA GPU may be present on this machine, but a CUDA-enabled jaxlib is not installed. Falling back to cpu.
dra=+12.00 ddec= -4.25: peak S/N   8.7 at 40.200 GHz
dra=+12.00 ddec=+23.50: peak S/N   2.5 at 40.254 GHz
dra= +4.25 ddec= -4.25: peak S/N   2.3 at 39.760 GHz
dra= +4.25 ddec=+23.50: peak S/N  11.6 at 39.893 GHz
jackknife max |S/N| 2.7
[6]:
response_check(mf)
[6]: